Wavefront sensing in the XUV with lateral shearing interferometry
High-harmonic generation is a nonlinear process which produces fully coherent XUV and soft x-ray radiation. As such, the full range of characterization techniques available for ultrashort laser pulses in the visible or infrared - temporal characterization e.g. with FROG or SPIDER, spectroscopy, spatial profiling with wavefront sensors - are also applicable in principle. However, the different linear and nonlinear optical elements available in the XUV and soft x-ray spectral regions mean that experimental implementations of these techniques are radically different.
With coworkers from Professor Ian Walmsley’s group at Oxford and the Attoscience group at Imperial College, we performed the first lateral shearing interferometry measurements of high-harmonic generation. This provides spectrally-resolved measurements of the intensity and phase of the harmonics. We were able to observe, for example, that wavefront curvature varies with harmonic order. This has implications for focusing attosecond pulses.
In general, in a lateral shearing interferometer, a beam \(E(x)\) is interfered with a displaced replica \(E(x+X)\) of itself. The resulting interference pattern is
where \(\phi(x)\) is the phase of \(E(x)\). By Fourier-domain filtering, the phase derivative \(\phi(x+X) - \phi(x) \approx X\phi’(x)\) is obtained. The phase is then recovered by integration or more sophisticated algorithms.
To implement lateral shearing interferometry with high-order harmonic generation, we use two separate laser focii located side-by-side in the target medium. The following figure illustrates the mechanism. The separate laser beams are produced in a Mach-Zehnder interferometer. When we laterally displace one arm of the interferometer, the beam is rotated at the corresponding focus. The harmonics fall onto a different place on the detector. A diffraction grating disperses the beam in the direction perpendicular to the displacement, so that the measurement is spectrally resolved.
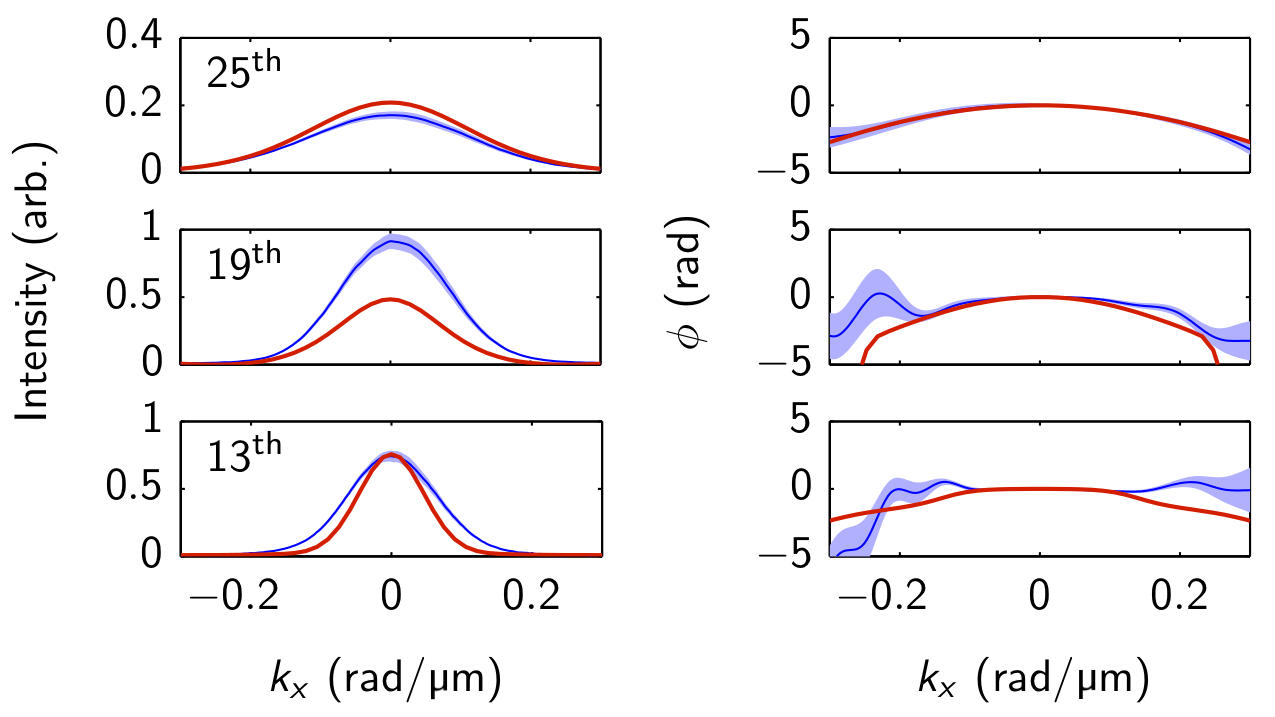
The following figure shows the intensity (left) and phase (right) for harmonics 13, 19 and 25 of a Ti:Sapphire pulse in krypton. The profiles are plotted in the far-field; that is, they are expressed in terms of the transverse wavenumber \(k_x\). The angular distribution varies markedly; in particular, the higher orders exhibit more phase curvature because of the intensity-dependent dipole phase, which increases with harmonic order for the short trajectories.