pyqtgraph and matplotlib together
Isosurfaces aren’t in the core matplotlib library, although they are certainly possible. Because of this, and my keenness to keep experimenting with pyqtgraph, I made a hybrid solution:
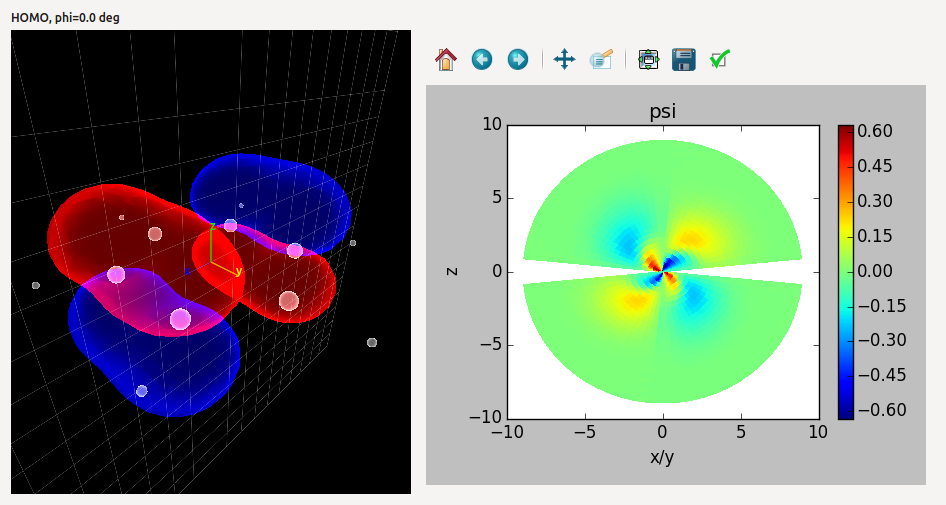
The left plot is done with pyqtgraph, and the right with matplotlib. The whole thing is a QWidget, its layout managed by Qt. The MatplotlibWidget class in pyqtgraph conveniently holds the matplotlib figure on the right.
I made a few customizations to pyqtgraph:
- A GLAxisItem (the yellow, green and blue lines indicating the coordinate axes) subclass that makes the lines thicker and adds text labels.
- A GLViewWidget subclass that corrects the default Qt sizeHint of the original, which is (-1,-1) and causes the widget to not be displayed. This corrects a known issue.