Pyqtgraph extensions package
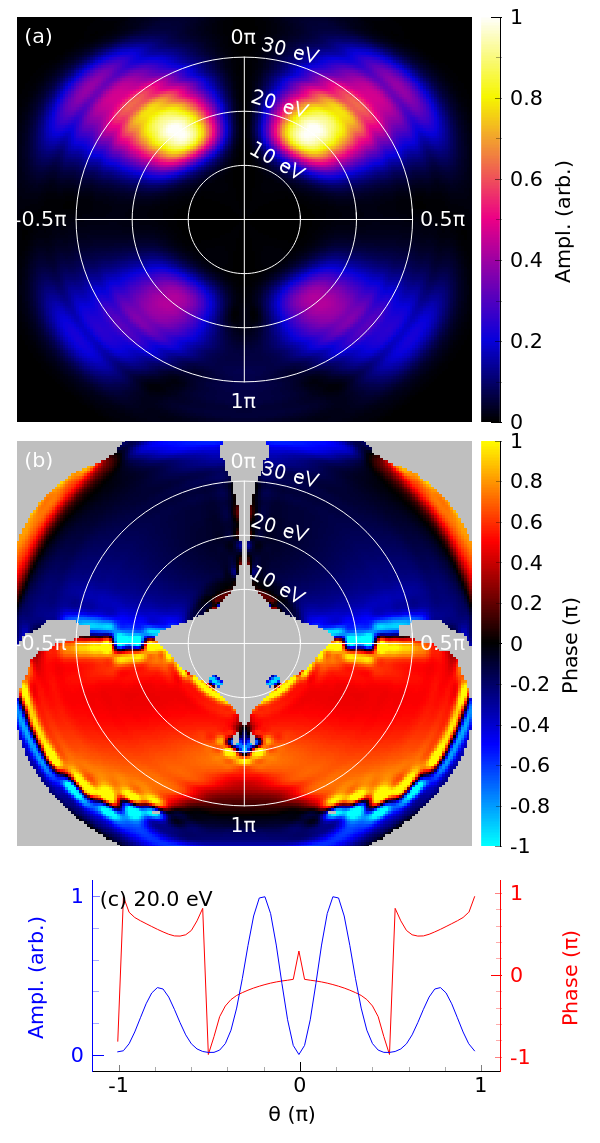
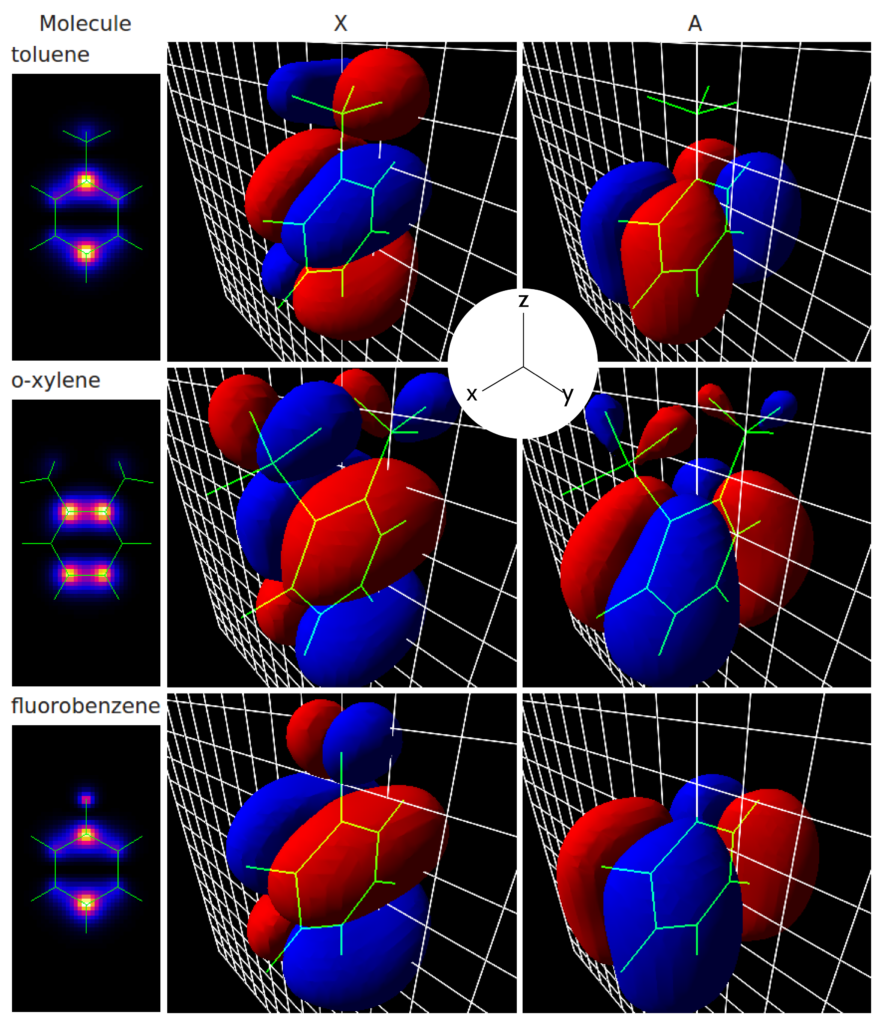
Over the past year year I’ve been using pyqtgraph extensively, both for laboratory apps and publication plots. I’ve been able to make some reasonably complex plots:
What I like most about pyqtgraph is the underlying use of Qt for layout management, the performance and the logical design of its internals, which makes extensions not too difficult to develop. However I have found it lack a bunch of features that I need – probably because I’m using it for static publication plots as well as in GUIs. I’ve bundled the various solutions that I’ve developed into a package pyqtgraph_extensions. It adds a bunch of features such as simplified exporting, a MATLAB-like colorbar and more powerful alignment of plots.