New release of pyqtgraph_extensions
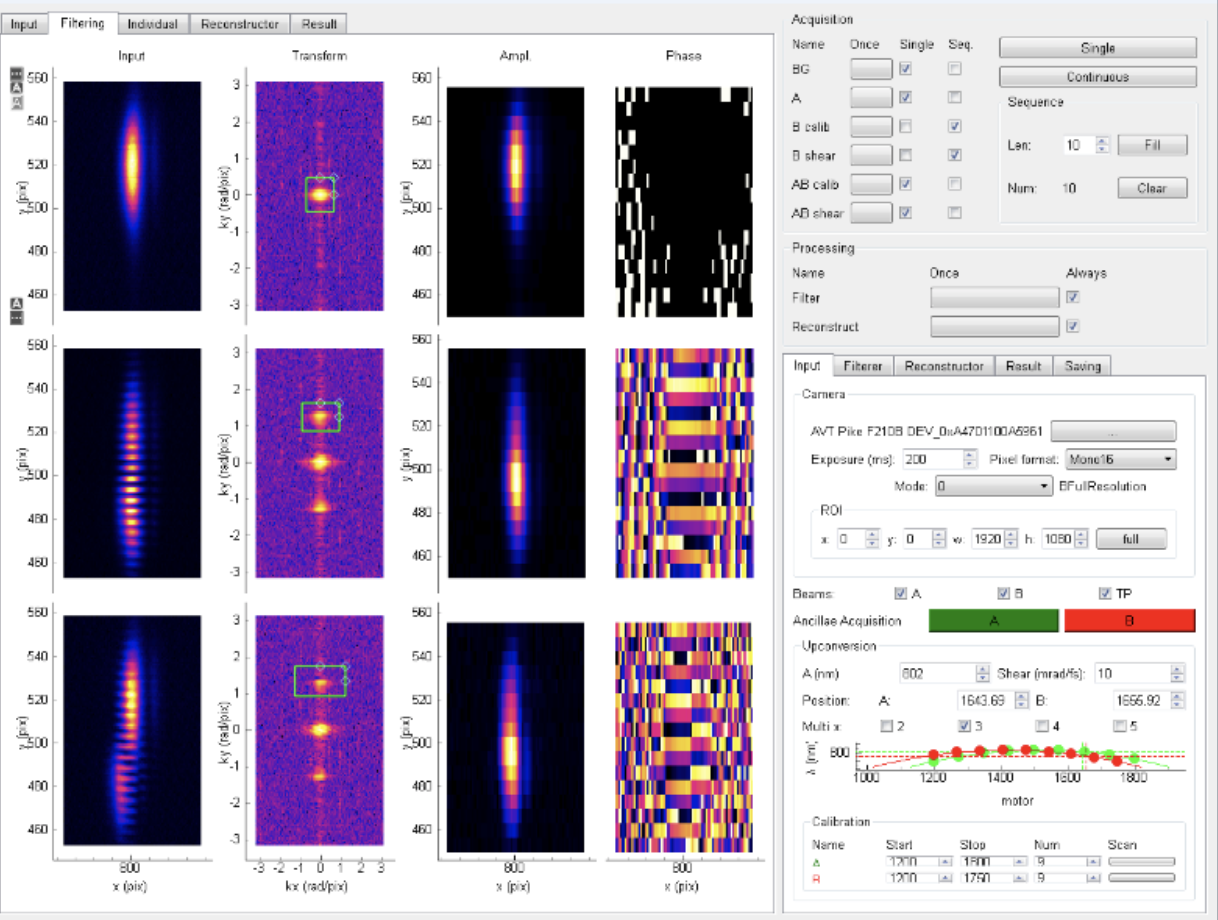
PyQtGraph is a great Python library for high performance plotting. I’ve used it extensively for UIs for laboratory instrumentation and interactive simulations. It handles complex UIs featureing many images, tabs, and controls with aplomb:
Over the years I’ve written a bunch of extensions for PyQtGraph as I’ve encountered the need. I was casually keeping them in single Git repo pyqtgraph_extensions. Today I finally got around to organizing / explaining / adding enough testing that I feel comfortable presenting it as a useful package for other PyQtGraph users. These are included in the the newly released v4.0.0.